


 46 / 68

6
Zahlen und Fakten 2012
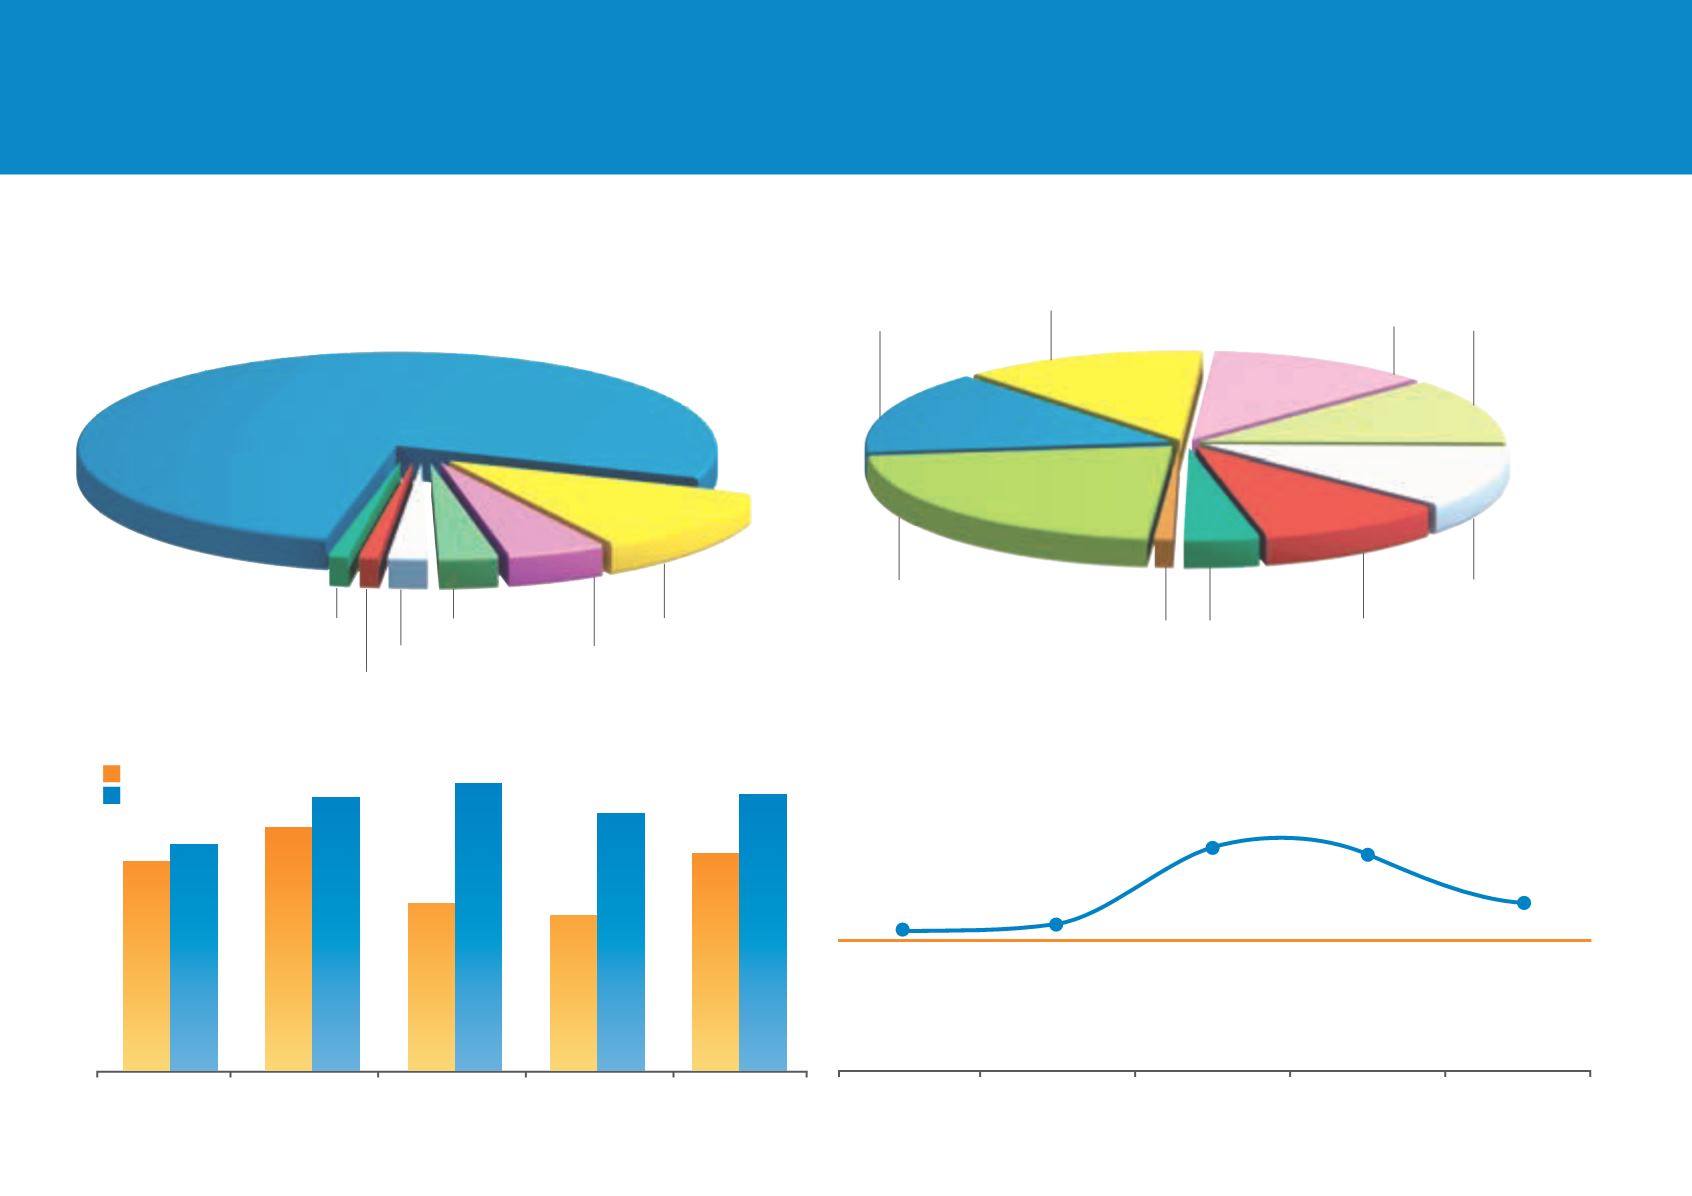
Umsatzstruktur 2012 nach Warengruppen Detailhandel
in Prozent vom Detailhandelsumsatz
Umsatzstruktur 2012 nach Sparten
in Prozent vom Nettoumsatz
Selbstfinanzierungsgrad 2008 – 2012
Cash Flow/Bruttoinvestitionen
Investitionen und Cash Flow 2008 – 2012
in Millionen CHF
Bruttoinvestitionen
Cash Flow
Fleisch/Fisch/
Geflügel 15%
Kolonial 22%
Übrige 1%
Backwaren/
Convenience 10%
Früchte/
Gemüse/
Pflanzen 11%
Haushalt/
Hygiene/
Kosmetik 12%
Milchprodukte 12%
Fachmarkt 13%
Bekleidung 4%
Fachmarkt 11%
Dienstleistungen 2%
Grosshandel 3%
Gastro/Hotel 5%
Bildung/Kultur 1%
Freizeit/Fitness 1%
Supermarkt
77%
2008
2009
2010
2011
2012
134
145
155
175
107
184
99
164
139
177
2008
2009
2010
2011
2012
100%
128%
166%
171%
112%
108%